Ah, almonds! These crunchy delights have taken the snack world by storm. But ever stopped to ponder the environmental cost?
Here’s your comprehensive guide to understanding the Almond Carbon Footprint in the US.
Let’s crack open the shell of this topic.
Almond Carbon Footprint in the US
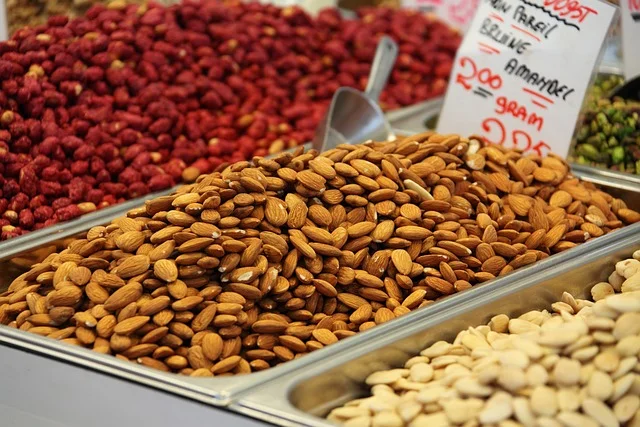
The story of almonds and their carbon footprint in the US is a tale of growth, prosperity, and unintended consequences. The United States, particularly California, is the global hub for almond production. While these nuts offer numerous health benefits and have become increasingly popular in diets and products like almond milk, their production comes at a significant environmental price.
First, consider the sheer volume of water required. With California’s already drought-prone setting, almond cultivation intensifies water scarcity issues. To quantify, it’s been estimated that producing a single pound of almonds requires about 1,900 gallons of water. Additionally, when considering the transportation, packaging, and processing of almonds, the carbon emissions begin to add up.
Furthermore, the vast stretches of almond farms lead to monoculture practices, which in turn can result in soil degradation and loss of biodiversity. The combination of water use, land use, and other factors contribute to a sizable carbon footprint, prompting many experts and consumers alike to question the sustainability of large-scale almond production in the country.
Historical Context of Almond Production
Almond farming in the US is not a recent phenomenon. The almond tree, originally native to the Middle East, found its way to the sunny coasts of California in the 19th century. By the early 20th century, farmers began recognizing the potential of the state’s Mediterranean climate — hot, dry summers and mild, wet winters — as an ideal setting for almond cultivation.
The 1970s and 80s marked a significant turning point. Health trends emerged, lauding the benefits of almonds, leading to a spike in demand. This surge was amplified with the advent of almond-based products, particularly almond milk, in the 21st century. As demand grew, so did the acreage, with almond farms expanding massively, especially in the Central Valley of California.
Environmental Concerns
The environmental implications of almond farming are multifaceted:
- Water Usage: As previously mentioned, the water footprint of almonds is high. In a state where water is gold, the extensive water use for almond orchards, especially during drought years, poses significant concerns.
- Pesticides and Soil Health: Almond farming, especially non-organic, relies on pesticides. These chemicals can leach into the soil, affecting its health and potentially running off into local water sources, impacting aquatic life.
- Bee Health: Almonds are entirely dependent on bees for pollination. Every year, billions of honeybees are transported to California almond farms. However, this has led to concerns over bee mortality rates, given the exposure to pesticides and the stress of transportation.
- Land Use and Deforestation: To accommodate the growing demand, stretches of land, sometimes forests, are cleared for almond farms. This not only contributes to carbon emissions but also disrupts local ecosystems.
Economic Impacts vs. Environmental Stewardship
The almond industry is undeniably a significant economic driver in the US, especially in California. Generating billions in revenue annually and supporting thousands of jobs, its economic footprint is substantial. Almonds rank as California’s top agricultural export.
However, the profitability of the almond industry is now pitted against growing environmental concerns. The debate rages between the economic boon the industry provides and the ecological cost it incurs. Some argue that the industry’s revenue can fund research into sustainable practices, while others believe that the environmental price is too high a cost for the economic benefits.
Balancing these two pillars—economic growth and environmental responsibility—has become central to the discourse around almond cultivation in the US. As awareness grows and consumers become more eco-conscious, the industry is under pressure to innovate and adopt more sustainable and less resource-intensive practices.
Possible Solutions and Sustainable Alternatives
As concerns rise about the environmental footprint of almond cultivation, several innovative solutions and sustainable alternatives have emerged:
- Technological Interventions: Modern technology is a boon for sustainable agriculture. Drip irrigation, a method that delivers water directly to plant roots, can significantly reduce water use. Additionally, AI-driven farming techniques can help optimize pesticide use, ensuring minimal wastage and reduced environmental impact.
- Organic Farming: A return to organic farming could be the answer to many environmental concerns. Without the reliance on chemical pesticides and fertilizers, organic almond farms have a lesser environmental footprint. The challenge, however, lies in scaling organic production to meet global demand.
- Regenerative Agriculture: This farming approach focuses on revitalizing the soil, promoting biodiversity, and creating a closed-loop system with minimal waste. For almond farms, this means practices like crop rotation, cover cropping, and natural pest management.
- Alternative Nut Crops: With the high water footprint of almonds, farmers could consider diversifying or shifting to other nut crops that may have a lower environmental impact, such as hazelnuts or pecans.
Almonds Water Consumption Patterns
Almonds have become a global dietary staple, especially in the US. However, their cultivation requires a significant amount of water. California, a primary almond-producing region, is often drought-stricken.
Each almond requires about 1.1 gallons of water. This volume quickly accumulates, given the massive scale of almond farms.
Given the pressing water scarcity issues, this has raised eyebrows about the sustainability of almond cultivation.
Almond CO2 Emissions Per KG
When evaluating the carbon footprint of food, almonds come under scrutiny.
On average, producing a kilogram of almonds results in around 2.83 kg of CO2 emissions. These emissions arise from various factors. Fertilizers, water pumping, and machinery operation contribute considerably.
Transportation, especially for exported almonds, further inflates this number. There’s a growing call for sustainable practices to minimize this carbon footprint.
Almond Food Miles
The concept of “food miles” gauges the distance food travels from its point of origin to the consumer, shedding light on the environmental impact during transportation.
Almonds, predominantly grown in California, often embark on extensive journeys to reach global markets. When we pick up a pack of almonds off the shelves in New York or London, it’s likely those nuts have traveled thousands of miles, contributing to their carbon footprint. Trucking, shipping and even air freight come into play.
Each mode of transport emits varying degrees of CO2. For consumers passionate about sustainability, understanding almond food miles can guide purchasing decisions. Opting for locally-sourced almonds, where available, or supporting brands that prioritize sustainable transportation can make a difference in reducing the environmental toll of these beloved nuts.
Comparing Carbon Footprints: Almonds vs. Other Nuts
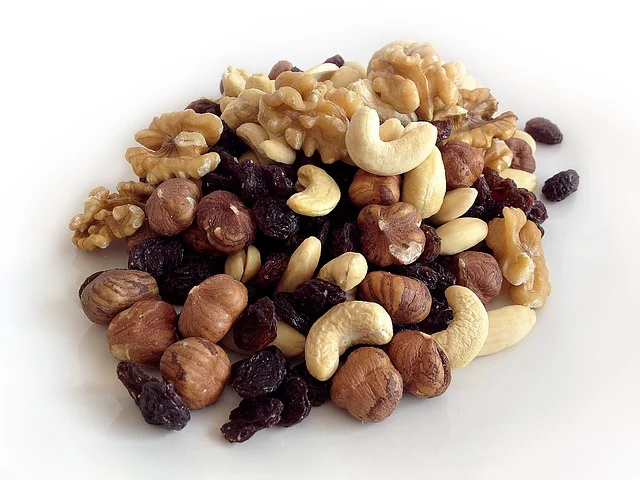
When analyzing the environmental impact of our food choices, it’s essential to make informed comparisons:
- Water Footprint: Almonds have been highlighted for their high water use, requiring approximately 1,900 gallons of water per pound. In comparison, walnuts require about 4,400 gallons per pound, making them even thirstier than almonds. On the other end of the spectrum, peanuts use a mere 368 gallons per pound, and hazelnuts fall in between at around 1,260 gallons per pound.
- Land Use: While almonds do require substantial stretches of land, so do other nuts like macadamias and pistachios. However, the conversion of forested areas or other ecosystems into farmland has a more pronounced carbon footprint.
- Pesticide Use: Almonds, especially in non-organic farms, require pesticides. In contrast, some nuts, like chestnuts, have lower pesticide requirements, reducing their environmental impact.
- Transportation Emissions: The carbon footprint of a nut also depends on how far it travels. Local, in-season nuts will always have a lower carbon footprint compared to those flown from across the world.
Top 30 U.S. Products by CO2 Emissions
In the battle against climate change, understanding the primary sources of carbon emissions is crucial. Our daily consumption patterns, often taken for granted, play a significant role in the global carbon footprint.
This section unveils the top 30 products in the U.S. responsible for the highest CO2 emissions.
From everyday items like cars and electronics to industries like beef production and coal mining, the list might surprise you.
| Rank | Product Category | Approximate Annual CO2 Produced (in million metric tons) | Notes |
|---|---|---|---|
| 1 | Cars and light trucks | 1,500-2,000 | Based on fuel consumption and number of vehicles. |
| 2 | Beef | 300-500 | Methane emissions converted to CO2 equivalent. |
| 3 | Electricity (coal-fired) | 1,000-1,500 | Based on coal’s share in the U.S. electricity mix. |
| 4 | Air travel | 150-250 | U.S. domestic and international flights. |
| 5 | Natural gas | 500-700 | Extraction, transportation, and combustion. |
| 6 | Dairy products | 150-250 | Methane emissions converted to CO2 equivalent. |
| 7 | Aluminum | 20-40 | Global aluminum production’s share attributed to the U.S. |
| 8 | Cement | 50-100 | U.S. cement production. |
| 9 | Plastics | 100-200 | Based on U.S. production and consumption. |
| 10 | Steel | 100-150 | U.S. steel production. |
| 11 | Electronics (e.g., smartphones) | 20-40 | Based on U.S. consumption and global supply chains. |
| 12 | Paper | 50-100 | U.S. paper production and consumption. |
| 13 | Heating oil | 50-100 | Based on U.S. consumption. |
| 14 | Rice | 10-20 | Methane emissions converted to CO2 equivalent. |
| 15 | Lamb and mutton | 5-10 | Methane emissions converted to CO2 equivalent. |
| 16 | Palm oil | 5-10 | U.S. consumption and global supply chains. |
| 17 | Fast fashion | 20-40 | Based on U.S. consumption and global supply chains. |
| 18 | Coffee | 10-20 | U.S. consumption and global supply chains. |
| 19 | Shipping | 50-100 | Based on U.S. imports and exports. |
| 20 | Poultry | 20-40 | U.S. production and consumption. |
| 21 | Pork | 20-40 | U.S. production and consumption. |
| 22 | Fertilizers | 10-20 | Nitrous oxide emissions converted to CO2 equivalent. |
| 23 | Hotels | 10-20 | U.S. hotel industry energy consumption. |
| 24 | Beer | 5-10 | U.S. production and consumption. |
| 25 | Wine | 5-10 | U.S. production and consumption. |
| 26 | Chocolate | 5-10 | U.S. consumption and global supply chains. |
| 27 | Coal mining | 50-100 | Methane emissions converted to CO2 equivalent. |
| 28 | Refrigerants | 10-20 | HFCs and other refrigerants’ global warming potential. |
| 29 | Soybeans | 20-40 | U.S. production and global supply chains. |
| 30 | Gold mining | 5-10 | U.S. consumption and global supply chains. |
Conclusion
The Almond Carbon Footprint in the US is undeniably a topic of concern.
While almonds bring numerous health benefits and economic prosperity, it’s essential to recognize and address their environmental impact.
By supporting sustainable practices and making informed choices, we can enjoy almonds without compromising our planet.
Sources
- U.S. Environmental Protection Agency (EPA)
- Website: EPA Website
- U.S. Energy Information Administration (EIA)
- Website: EIA Website
- The World Resources Institute (WRI)
- Website: WRI Website
I’m Thomas, the owner of SustainableWave. Passionately promoting a sustainable planet. With experience in various eco-roles, I’ll share green tips, sustainability hacks, and personal eco-journeys on my blog.